
Scroll to explore the key data.
For a full decade, our annual benchmarks have helped talent acquisition teams sharpen how they plan, measure, and optimize their recruitment marketing.
This year, we're raising the bar with two big updates. We've added international benchmarks from select markets outside the United States so global and expanding teams can see how performance shifts by country or region. And we've brought in disposition data that goes further down-funnel to show how candidates move through screening, interview, and offer stages, and how those conversion patterns connect to overall hiring cost.
Appcast's analysis utilizes 2025 job ad data from nearly 1,200 employers in the US
Mobile: 70.64% / Web: 29.36%
Supply and demand in near perfect balance.
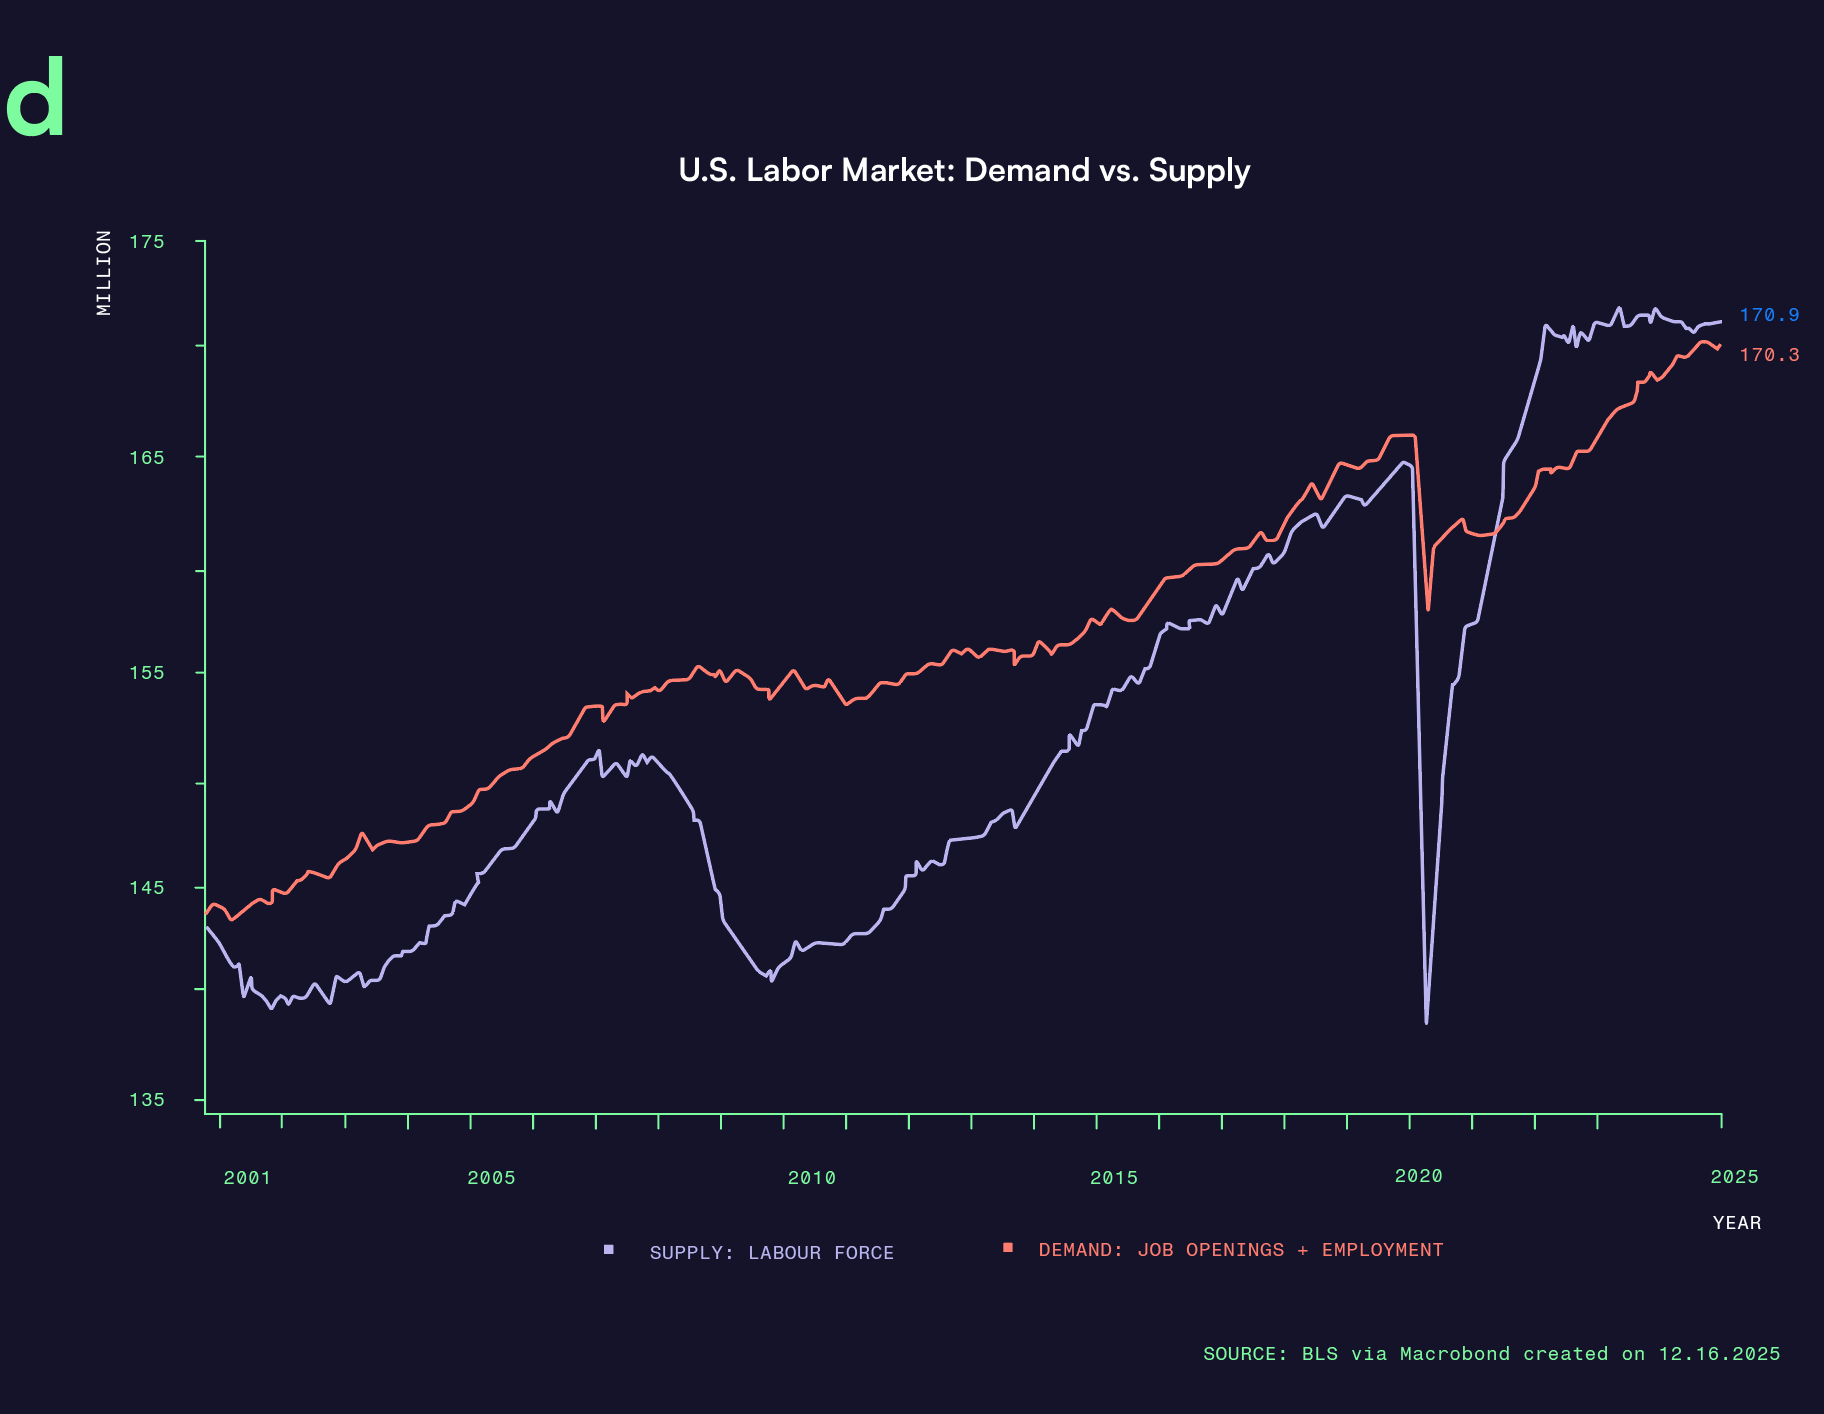
Labour Force
Job Openings +
Employment
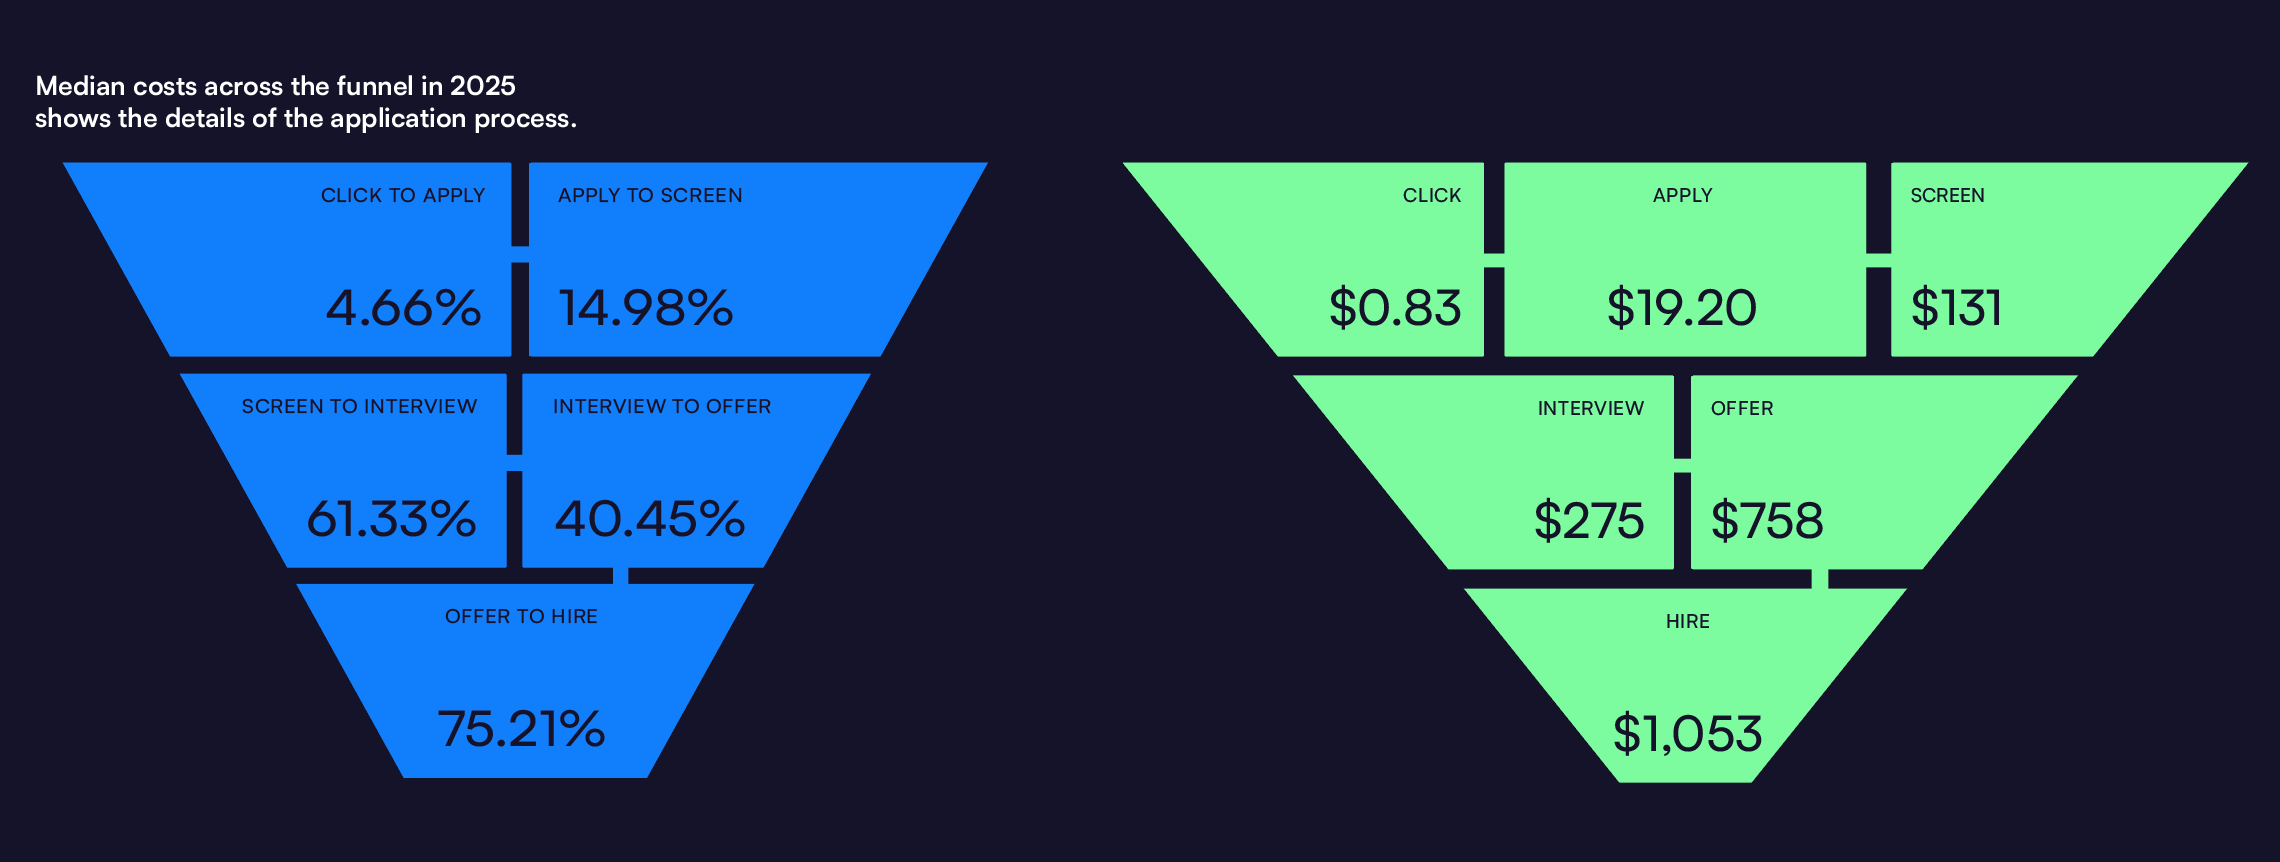
Median costs across the funnel shows the details of the application process.
Download the full benchmark report
Discover how you stack up against recruitment marketing performance benchmarks.